

Lab Notebook
Overview
Over the course of our experimental work, our major aims involved firstly, to synthesise our cargobay design and observe the three separate configurations intended from the one design. Second, to confirm the functionality of the system such that it can selectively bind target molecules and switch between closed and open states for capture. Essentially, the presentation of our current work serves to demonstrate the foundational basis for a nanoplastic capture system to eventually be applied in vivo.
Practice and Optimising Folding Conditions
Background:
Our team was lucky enough to get to work with some of USYD's DNA origami experts with two previous members of the DNA nano group having worked with their own barrel designs. These versions did not have a hinge system nor include handles for targeting mechanisms but were structurally very similar to our closed configurations. Whilst waiting for the arrival of our DNA staples, we decided that practicing the DNA origami folding protocols would not only be useful preparation but could also be used to determine the optimal folding conditions assuming these to likely be applicable to ours in addition to generating potential positive and negative controls to be used as comparisons for our future experiments since they have been verified.
Self-assembly of origami is quite drastically affected by its folding environment. Both the duration of the annealing step and the salt concentration are environmental factors that are known to significantly contribute to the resulting folded product. Generally, as a rule of thumb, the more complex the structure the more time needed for synthesis. Buffers containing salt are used in the preparation of DNA origami to reduce the electrostatic repulsion of the negatively charged phosphate backbones to facilitate DNA strands coming into proximity, an essential element in the folding of desired structures. However, a sweet spot for an appropriate salt concentration must be hit where it needs to be high enough such that the DNA folds correctly but not so high that it results in the aggregation of DNA. In order to test a range of these conditions, each of these barrels will be prepared at three different annealing times (18 hr, 48 hr, 66 hr) for each different MgCl2 concentration (4 mM, 10 mM, 16 mM).
Since we are essentially repeating the optimising experiments done by both Matthew Turner and Jonathan Berengut who had previously validated their designs by TEM, we only analysed our results using gel electrophoresis to confirm we were able to reproduce their results.
Protocol:
-
Since the plates were already hydrated, begin from pooling staples - pipette required volumes from each of the wells detailed in the relevant tabs and place the droplet on a piece of parafilm. Using a pipette fitted with a tip, combine all droplets together on the parafilm surface and transfer to an appropriately labelled eppendorf tube.
-
Prepare separate 1 mL of 10X folding buffer (FB) for each different magnesium concentration (4 mM, 8 mM, 16 mM)
-
Add all required reactants for the DNA origami annealing reaction.
- Subject each of the different barrel designs for each different magnesium concentration to the three different annealing conditions :
-
66 hour - Decrease by 1°C every 6 h 36 min. Ramp from 50 - 40°C.
-
48 hour - Decrease by 1°C every 4 h 48 min. Ramp from 50 - 40°C.
-
18 hour - Hold at 48°C.


Version 1 Folding
Background:
Now that our DNA has arrived, it was time to test to see whether our design could self-assemble into the desired structure. Based off the previous experiment, we were confident that 18 hours would be a sufficient annealing time to allow our DNA to fold properly. However, we did investigate the effects of varying the salt concentration of the folding environment. As before, if salt concentrations are too high, the DNA will aggregate and we will expect to see the DNA essentially stuck in the well while if the concentrations are too low, the origami will not fold and a distinct band where our DNA origami structures should reside is unlikely to appear.
Origami Synthesis Protocol
We receive all the required staples necessary to fold our DNA scaffold into our desired structure in 96-well plates. All staples need to be hydrated and can be stored in this state serving as our stock solutions of each staple. In this step, we calculated the required volume of water to be added to each well based on the data provided from the plate specifications sheet such that each well had a concentration of 200 uM.
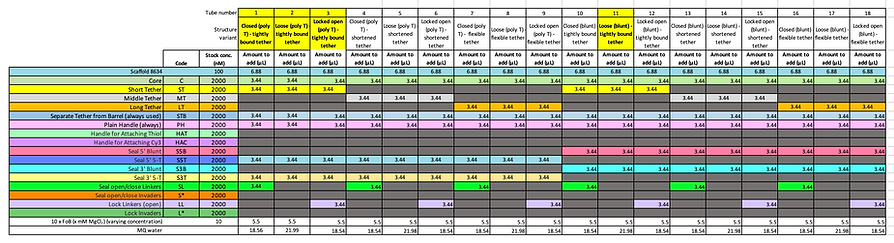
To improve the efficiency of repeated synthesis of our barrels in addition to providing the flexibility, we needed to fold all the various modifications (hinge configurations, tether lengths and blunted or poly-T ends) for each design. Thus, the staples were purposefully pooled into groups as outlined in the table below:
Our standard synthesis protocol involves a total reaction volume of 55 uL (not exceeding this volume encourages uniform heating during the annealing step as the reaction volume does not sit higher than the height of the sample heating block). It contains the appropriate staples, 12.5 nM M13mp18 scaffold plasmid (p7249), 10 mM MgCl2, 100 mM Tris and 10 mM EDTA folding buffer. The samples are annealed using the following temperature cycle:
-
Denature at 65°C for 15 minutes
-
Hold at 48°C for 1065 minutes (or 17 hours and 45 minutes)
-
Hold at 4°C
Optimising the salt conditions for the initial synthesis of the cargo bay:
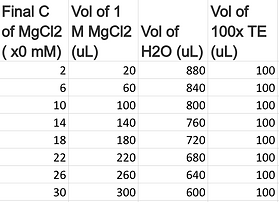
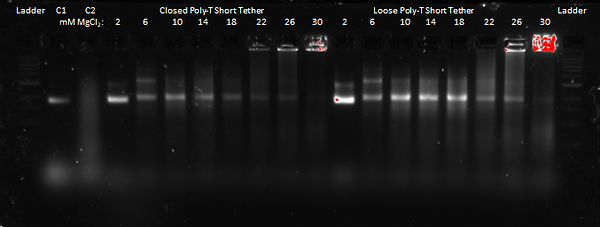
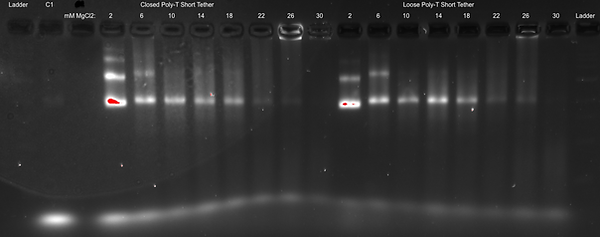
Whilst being relatively confident that the conditions identified in the previous experiment will work well, we decided to test a vast range of folding buffers varied by their MgCl2 concentration (2, 6, 10, 14, 18, 22, 26 and 30 mM, as shown below) to confirm the optimal magnesium concentration to use in all subsequent experiments. Only two different barrel compositions were used to investigate the effects; including both the closed and loose configurations that have poly-T ends and the shortened tether design. Thus, the eight different folding buffers were prepared in separate tubes and were each separately used in making up the annealing reaction mixes for the eight aliquots of the different barrel compositions. They were then subjected to the annealing temperature cycle outlined above.
Results of Optimising the Salt Conditions:
Discussion of Optimising the Salt Conditions:
These results for the closed poly-T short tether and loose poly-T short tether appear to show that a MgCl2 concentration of 10 mM is the most favourable for forming our DNA Cargo Bay design, as expected. That is because for both designs, the gel band at 10 mM appears to be the most distinguished (so without smearing) as well as that it shows the most fluorescence. This means that there is more DNA present, and, therefore, provides more evidence for that the DNA Cargo Bay likely folded the most efficiently at that MgCl2 concentration.
At higher MgCl2 concentrations, we see more smearing as well as aggregation in the wells (specifically at concentrations above 22 mM for the closed design and 26 mM for the loose design), which suggests that the DNA is too large to move through the gel. At lower MgCl2 concentrations, the gel bands are very fuzzy and run faster, which also suggests a malformation of the DNA Cargo Bay design.
Optimising the Structural Changes in the Design of Cargo Bay:
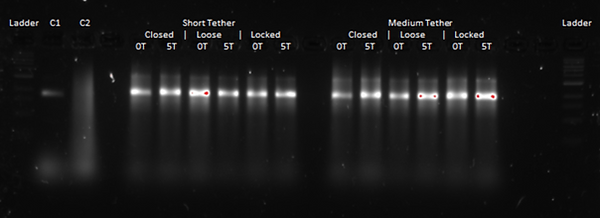
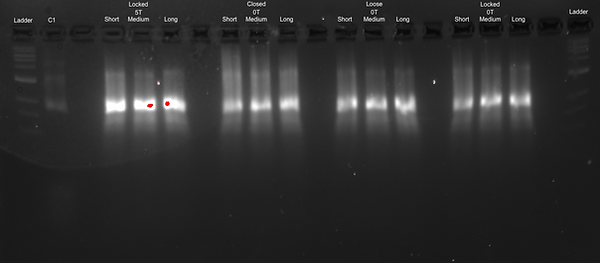
In order to see whether the different endings (poly T or blunt) have an effect on the dimerisation of the DNA Cargo Bay design, we used both types of endings in each of our designs with each of the different tether lengths so as to be able to optimise the folding conditions for our DNA Cargo Bay design. We expected the poly T endings to favour the formation of monomers, which is what we aim for our Cargo Bay design. Also, as about 150 more base pairs are included in the poly T design through the addition of TTTTT endings, we would expect it to move slower through the gel. We also expected to see a difference in gel position between the different designs: as the closed Cargo Bay is condensed, we expected its gel bands to run faster than those of the other loose and locked open designs. Additionally, for these experiments, the negative control (C2) does not seem to form. We believe that the scaffold may not have been added accidentally. This agarose gel was run at 1.5 % at 60 V for 3 hours.
Results of Optimising the Structural Changes in Design:
Discussion of Determining the Structural Changes in Design:
From these results, we were able to see that the poly T or blunt endings looked rather similar, although for some gel bands, there seems to be a very slight shift where the poly T moves more slowly than the blunt ends. This was expected, as having poly T endings adds about 150 base pairs to the design, making it heavier and therefore, we expected it to move more slowly. In terms of the different designs, since the closed state is more condensed than the other two states, we expected it to run faster. However, from our results, we could not conclusively tell a difference between the band locations. Therefore, we decided to run the gels again at a higher agarose gel concentration as well as for a longer runtime, in order to hopefully be able to enhance the gel band separation. Additionally, to get a clearer idea of what was going on, we wanted to TEM image some of our gels.
Second Attempt at Determining the Structural Changes in Design:
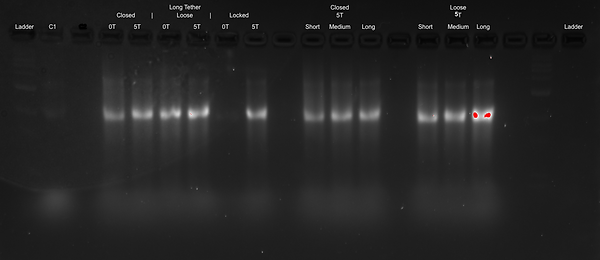
Here, we reran the above, although without the negative control C2 as that hadn't formed correctly as described earlier. The only things we changed were that we used a 2 % agarose gel as well as that we ran it at 60 V for 4 hours. From this, we hoped to get enhanced separation of the gel bands so as to be able to have more conclusive indications about the conformational differences between our locked open, loose and closed conformations.
Results of Second Attempt:
Discussion of Second Attempt:
Similar as the first attempt, from the results for the closed poly-T short tether and loose poly-T short tether, it seems that a MgCl2 concentration of 10 mM is the most favourable for forming our DNA Cargo Bay design. For both designs, the gel band at 10 mM appears to be the most distinguished (so without smearing), and it appears to fluoresce the most, which suggests that more DNA is present there. At higher MgCl2 concentrations, we see more smearing as well as aggregation in the wells, which suggests that the DNA is too large to move through the gel. At lower MgCl2 concentrations, the gel bands are very fuzzy and run faster, which also suggests a malformation of the DNA Cargo Bay design.
This second attempt of running the gel electrophoresis for the different states (closed, loose and locked open), tether lengths (short, medium and long), and different endings (poly T and blunt) unfortunately also did not give us conclusive results. Again, the gel bands appear very similar in location for both the different design states (closed, loose and locked open) as well as the different endings (poly T and blunt).
Additionally, in reviewing our design before getting any TEM images, we realised that we were only using about 2000 bases of the around 7000 present in the scaffold. This means that most of the mass of our design was coming from the excess scaffold. Because the difference in mass of the scaffold to the barrel is about 3.5 times more, it would significantly slow down the speed of DNA running through the band and may even hold the barrel movement back, which could explain why all bands are very similar. As a result, we decided to redesign our Cargo Bay structure by lengthening it. This would reduce the amount of leftover and unused scaffold and would hopefully show more distinct results in terms of gel band location differences between the closed, loose and locked open designs.


TEM Imaging
Background
Transmission Electron Microscopy (TEM) is a powerful imaging technique in the field of structural biology and materials science. It enables researchers to visualise structures at the nanoscale, providing invaluable insights into the fine details of various specimens. TEM works by transmitting a focused beam of electrons through a thin section of a sample, and the interactions between electrons and the sample create high-resolution images.
In our research, TEM analysis plays a pivotal role in validating the successful creation of CargoBay version 1, a complex molecular structure. However, it's important to note that our structure, which includes small molecular mass elements such as carbon (C), nitrogen (N), and oxygen (O), presents unique challenges when it comes to TEM imaging. These light elements have limited electron-capturing abilities, which can make it more difficult to discern fine structural details. Despite this challenge, TEM remains a critical step in our validation process.
The significance of TEM analysis in our research lies in its ability to reveal and confirm the presence of expected features within each of the variations of CargoBay version 1. Whether we are examining the sealed shut configuration, the loose configurations with different end modifications, or the locked open configuration, TEM allows us to visually inspect and assess the structures, thus confirming their integrity and adherence to the designed specifications. This validation step is essential to ensure the functionality and performance of our CargoBay version 1 in various states, ultimately advancing our understanding of its behaviour and capabilities.
It is worth noting that we did not perform the TEM imaging ourselves; rather, the images were expertly captured by Minh, a member of Shelley Wickham's DNA group, who is trained in using the TEM machine. Minh's expertise in TEM imaging has been invaluable in providing us with the high-quality images needed to advance our understanding of CargoBay version 1 and its behaviour at the nanoscale.
Tube 1 - Sealed Shut Configuration (polyT)
In this configuration Sealing Strands bind to sections on both sides of the doors , against the main barrel and between each other, holding them closed and flush. We should not observe any open configuration nanostructures in these structures. As the design features an outer DNA helix 267 base pairs long we should expect the outer diameter of a circle made by such a helix to span approximately 29 nm in diameter. In addition the inner diameter of the created barrel consists of a helix 189 nm in length, resulting in an expected inner diameter of approximately 20 nm
As we explore the TEM images within the "Sealed Shut" configuration, we aim to validate the successful implementation of these design principles and expectations. The TEM analysis will help confirm whether the Sealing Strands effectively secure the doors and prevent open configurations, and whether the observed measurements align with the anticipated outer diameter of the DNA helix. Through this examination, we can gain valuable insights into the structural and functional aspects of CargoBay version 1 in its "Sealed Shut" state, contributing to the broader understanding of its behaviour and capabilities.
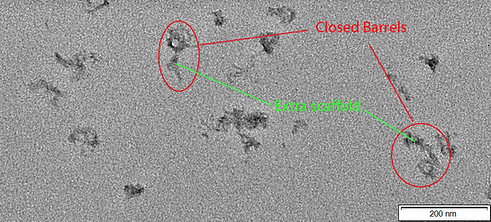
Figure 1: TEM image of CargoBay version 1 in the Sealed Shut configuration. Visible are two barrels clearly in the closed conformation. Also evident is the large amount of excess scaffold present in our design. A few other smaller structures are visible, likely misfolded barrels. The two barrels from left to right have a measured outer diameter of 41.1 and 43.4 nm and an inner diameter of 13.1 and 14 nm respectively. Conducted at 120 kV voltage giving 100000x magnification.

Figure 2: TEM image of CargoBay version 1 in the Sealed Shut configuration. Visible are three more barrels clearly in the closed conformation. All are similar sizes to those seen in Figure 1. Also evident is the large amount of excess scaffold present in our design. Conducted at 120 kV voltage giving 100000x magnification.
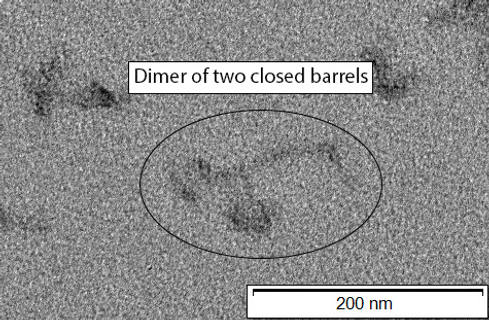
Figure 3: TEM image of CargoBay version 1 in the Sealed Shut configuration. Visible are two barrels in the closed conformation that have dimerised via tangling of the excess scaffold; this agrees with analysis via gel electrophoresis as dimer bands are visible in those experiments. Conducted at 120 kV voltage giving 100000x magnification.
Figure 1 serves as an integral piece in our validation process, shedding light on the essential structural elements within the "Sealed Shut" configuration of CargoBay version 1. This figure, while successful in confirming the presence of the expected features of tube 1, does present some intriguing observations that warrant discussion.
The most prominent observation in Figure 1 is that the measured outer diameter of the barrel appears somewhat larger than what was originally anticipated. Additionally, the inner diameter of the barrel appears to be slightly smaller than the design specifications. It's important to acknowledge that these discrepancies may be attributed to the inherent limitations of the TEM analysis technique itself.
One noteworthy limitation is the precision of the measurement technique, particularly when employing Photoshop's ruler tool for size determination. The reliance on 2D images to assess 3D structures can introduce subtle inaccuracies, leading to deviations in measured dimensions. Furthermore, the measurements assume that the nanostructure is viewed precisely end-on, which may not always be the case.
Within the inherent accuracy of our measurements, it is reassuring to note that the barrels are still generally within the range of expected sizes. The presence of the main structural features in the sealed shut configuration confirms the success of our design, demonstrating the ability of Sealing Strands to hold the doors closed as intended.
Figure 2 further validates the reliability of the technique of DNA origami for the creation of our nanostructure presenting several more examples of the expected shape and size for the Sealed Shut configuration.
Furthermore, the dimerisation evident in Figure 3 of two barrels validates observations made during the gel electrophoresis investigation of our DNA origami. In this image, the dimerization of two barrels in the "Sealed Shut" configuration is clearly evident. This phenomenon aligns with what we previously observed in our gel electrophoresis experiments, where dimer bands were detected. The correspondence between Figure 3 and our electrophoresis findings is a vital validation of our analysis of our design.
Tubes 2 and 11- Loose Configuration
We now move on to an investigation of images taken of our barrels in the loose configuration, created in tubes 2 and 11. The differences between these are that tube 2 features small extensions of DNA called polyTs. We believed these polyT extensions to be necessary as DNA has another way it can bind to itself apart from watson-crick base pairing, a phenomenon known as pi-pi stacking.
In contrast, Tube 11 explores an alternative design element, implementing blunt ends instead of polyTs. The absence of polyT extensions aims to evaluate the necessity of these additional features and to understand their specific role within the loose configuration.
The success of the Loose state is pivotal to the functionality of our design, as switching between the Locked Open and Sealed Shut states involves first passing through the Loose Configuration.
The juxtaposition of the TEM image of tube 2 in figure 4 compared to that of tube 11 in figure 5 demonstrates the success of this design consideration. In tube 11 we observe several barrels in both the open and closed states as opposed to only semi circular shapes in tube 2. This validates the importance of the polyT extensions in allowing a smooth transition between the Locked Open and Sealed Shut conformational states.
Tube 3 - Locked Open Configuration
Finally, TEM imaging of the Locked Open conformation is the final step in the complete validation of our successful design. The locked open configuration features several Locking Strands which are complementary to sections on the main barrel body and on the outside of the doors. These strands act to hold the barrel open exposing its inner structure to the surrounding solution. This configuration is vital for the successful functioning of our device to capture nanoplastics from the bloodstream as the inner surface is lined with functional aptamers especially sticky to the plastic particles.
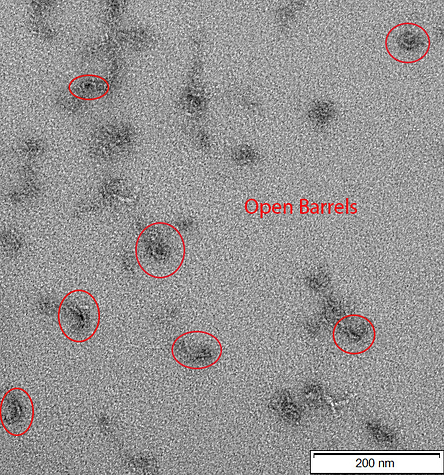
Figure 4: TEM image of CargoBay version 1 in the loose configuration (polyT). Visible are several semi-circular shapes, consistent with barrels in the open conformation. The excess scaffold is less evident, although likely to be contained in the dark image artefacts nearbyt he barrels. The sizes are about as expected, averaging around 28 nm in diameter. However visible is the increased flexibility of the loose state, causing most of the visible structures to not be a perfect semi-circle. Doors of the barrel are not clearly evident in this image. Conducted at 120 kV voltage giving 100000x magnification.
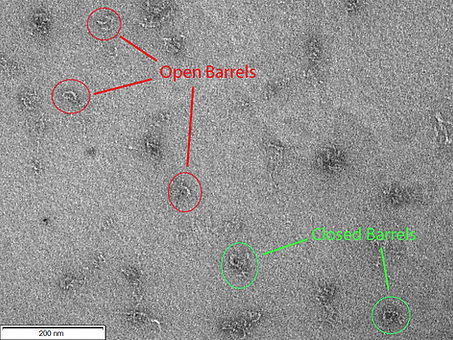
Figure 5: TEM image of CargoBay version 1 in the loose configuration (blunt ends). Visible are several semi-circular shapes, consistent with barrels in the open conformation. In contrast with figure 4 there are also several barrels that appear to be in the closed state, although it is possible they may be a dimerisation of two loose barrels. In either case this validates that our addition of polyT tails to the location of the hinges of the CargoBay prevents the barrel from taking on a closed state in the absence of Sealing Strands or dimerisation of the blunt ends as desired. Conducted at 120 kV voltage giving 100000x magnification.
_tif.png)
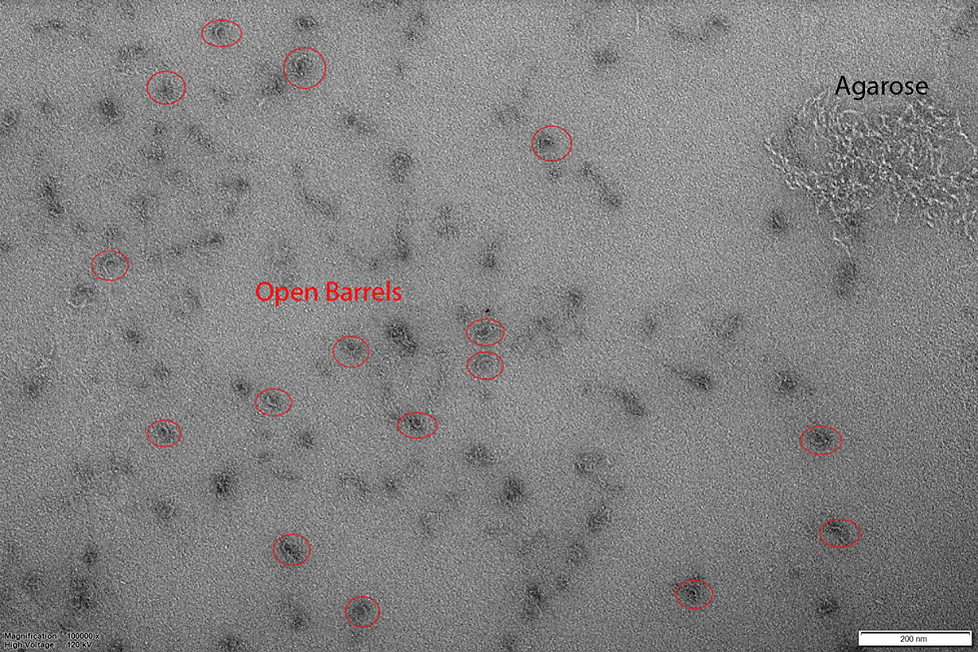
Figure 6: Wide Field TEM image of CargoBay version 1 in the locked open configuration. Visible are several semi-circular shapes, consistent with barrels in the open conformation. There are no closed barrels evident. All barrels imaged average about 32.5 nm in outer diameter. Agarose gel not successfully purified from gel extraction is visible in the top right of the image. Conducted at 120 kV voltage giving 100000x magnification.

Figure 7: TEM image of CargoBay version 1 in the locked open configuration. Visible are several semi-circular shapes, consistent with barrels in the open conformation. Image fidelity is worse than the previous image but included for demonstration of the consistency in shape and size of our design. Conducted at 120 kV voltage giving 100000x magnification.
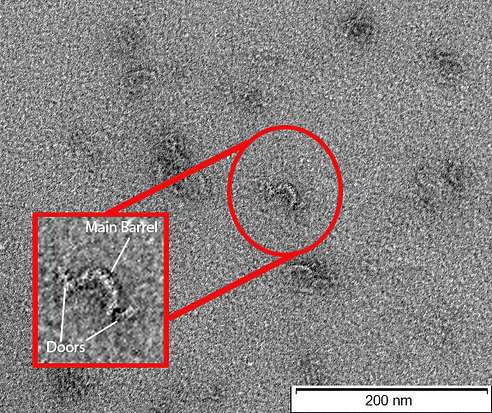
Figure 8: TEM image of CargoBay version 1 in the locked open configuration. Image-in-image shows an enlarged view of a single barrel. Clearly evident is the main semi-circular body and two doors held against the main body in the expected manner by Locking Strands. Excess scaffold is not clearly evident here. Image-in-image was constructed via a scale transformation and was enhanced for greater visibility of the features using the sharpen tool in photoshop. The main image in the background remains unedited. Conducted at 120 kV voltage giving 100000x magnification.
Figures 6 and 7 collectively present a compelling visual demonstration of the reliable creation of the "Locked Open" conformation. These images reveal numerous semi-circular shapes, each closely adhering to the expected size and shape for this configuration. This consistency underscores the precision and reproducibility of our design, confirming the reliability of the "Locked Open" state.
In Figure 8, a closer examination of a singular barrel within the "Locked Open" configuration is presented. This close-up view reinforces the validation of expected features, offering an in-depth look at the main semi-circular body and the Locking Strands, which securely hold the doors in place. The image-in-image representation provides enhanced visibility of these features, further validating the design and reinforcing the reliability of this configuration.
In summary, the "Sealed Shut" conformation, following the "Locked Open" state, represents the culmination of our design validation. The successful creation and confirmation of the "Locked Open" state, as depicted in Figures 6, 7, and 8, provide essential evidence of the functional integrity of CargoBay version 1 and its capability to effectively capture nanoplastics from the bloodstream. This achievement is a pivotal step in advancing our research and its potential applications in nanoscale engineering and biomedical science.
Conclusion
In conclusion, our Transmission Electron Microscopy (TEM) analysis has played a pivotal role in the validation of our CargoBay version 1 design. Through the detailed examination of various configurations, we have achieved a comprehensive understanding of the nanostructures and their behaviour at the nanoscale.
In the "Sealed Shut" configuration, we confirmed the presence of key features, despite minor measurement discrepancies attributed to the limitations of our measurement techniques.
Analysis of Barrel Size from TEM images
Statistical Analysis of Measured Sizes:
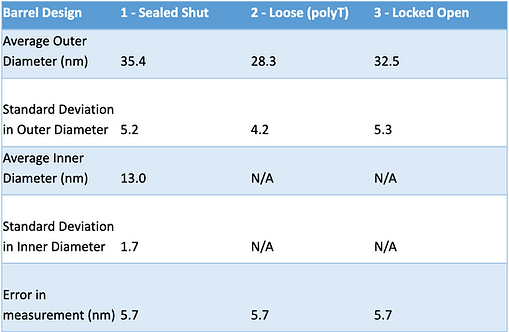
To ensure the accuracy of our measurements and to account for potential variations in the sizes of the structures, a statistical analysis was performed on the data obtained from our TEM images. We measured the outer diameters of multiple structures within each configuration, including the "Sealed Shut," "Loose Configuration," and "Locked Open" states. The measurements were taken from various sections of each TEM image to account for any potential variations across the specimens.
Inaccuracy of the Method:
It's important to acknowledge that the precision of our measurements is subject to certain limitations, primarily due to the nature of TEM analysis. The primary sources of inaccuracy include:
2D Imaging: TEM analysis relies on 2D images, and while these images provide detailed information, they can introduce subtle inaccuracies when assessing 3D structures. The view angle in a 2D image may not always align perfectly with the structures' orientation, which can lead to deviations in measured dimensions.
Image Processing:
The use of software tools, such as Photoshop's ruler tool, for size determination can introduce some degree of error. These tools rely on the operator's interpretation and judgment, and variations in this process can lead to measurement discrepancies.

Within The Limits of Accuracy
Figure 9: Boxplot demonstrating the distribution of observed sizes between the three conformational states. Tube 1 - Sealed Shut systematically is larger than expected, which can be attributed to difficulties in precicely determining the borders of the barrel. Tubes 2 and 3 agree with expected results.
Table 1: Statistical summary of observed barrel sizes in each conformation
Despite these acknowledged limitations, our statistical analysis reveals a consistent trend. The measured outer diameters of the structures generally fall within a relatively narrow range, with only minor variations observed. These variations are well within the range of measurement error for TEM analysis.
Notably, the average measured outer diameters of the structures in the "Sealed Shut" configuration align closely with the expected 29 nm diameter. While there are slight discrepancies, these fall well within the expected margins of measurement error for TEM analysis. This observation provides strong evidence that our design and implementation of the CargoBay version 1 structures are in good agreement with the anticipated dimensions.
The fact that our measurements remain consistent and within the expected range, despite the inherent inaccuracies of TEM analysis, reinforces the reliability of our research and supports the validity of our design. It underscores the effectiveness of the Sealing Strands in securing the doors and maintaining the "Sealed Shut" state, which is critical for the functionality of CargoBay version 1.
Target Molecule Binding
Background:
One of the crucial aspects of our design involves the capacity for the inside of our barrel to capture specific molecules. We want to confirm that the inclusion of our tether parallels a space shuttle's canadarm in that it can assist in the capture of target payloads. To showcase our proof of concept within the BIOMOD project's timeframe, we decided to focus on the selective targeting of Cy3, an orange fluorophore and gold nanoparticles. This choice not only allowed us to examine a vital aspect of our design but also provided visual assistance to support our analyses. We used two different preparations of gold nanoparticles (5 nm spheres and 20 nm spheres) to examine the impact of target particle size on the system's capability to capture them. Our primary focus was to explore binding events in each configuration, including closed, loose and locked open states in addition to each distinct tether design, particularly interested with whether the flexible tether could enhance binding by reaching farther distances.
Preparation of samples:
The first part of this experiment involved synthesising the barrel compositions we wanted to investigate The origami structures were prepared following the same protocol detailed above with the reaction mixtures for each design composition outlined below:
Additional notes: All cargo bay structures contain poly T extensions at the hinge sites.
"control" describes cargo bay structures that possess handles that are not designed to target any specific molecule, "thiol" describes structures that possess handles capable of targeting our prepared DNA conjugated gold nanoparticles and "Cy3" describes structures that possess handles capable of targeting Cy3 fluorophores.
Purification of origami:
After folding the required cargo bay structures, PEG precipitation was used to purify the cargo bay origami structures such that the excess of staples added to the folding reaction can be removed.
Standardisation of origami concentration:
After purification now hopefully containing just our origami structures, the concentration of DNA in each sample was investigated in order to correct for variations in the concentration for subsequent steps in our binding experiment. This was an important step to allow for better qualitative comparisons to be made when evaluating the impact of the structural differences between each sample on binding events. A nanodrop was used to acquire this information measuring the absorbance at 260 nm.
Binding reactions:
The chosen target molecule to be added to each cargo bay structure variant was outlined above and binding reaction mixtures were created according to the volumes listed in the table below. The reaction mixtures were then incubated overnight at 25 °C.
Gel Results and Discussion:
An agarose gel was cast at 1.5% made with a 20 lane comb and run at 60 V for ~3 hours according to the general protocol. 20 uL of each sample was loaded into the corresponding wells of a pre-determined gel order layout:
Unfortunately when using the GelDoc imaging system in the Cy3 filter (where Cy3 fluorophores should fluoresce) and coomassie filter (where gold nanoparticles should fluoresce), we were unable to retrieve results for the binding of these target molecules since their concentrations were too low. This led to undertaking experiments to optimise the yield of the gold nanoparticles discussed in detail further down.
However, the one gel that we gained from this experiment was imaged in the Sybr Safe filter and thus visualises DNA with the intensity of fluorescence proportional to the concentration of DNA in the sample providing insights into extraction efficiency. Interestingly, we observed significantly higher proportions of fluorescence for the tightly bound tether variants in each of the closed and locked open configuration sets and thus suggesting that this tether variant may allow for the most efficient folding.
Second Attempt at Demonstrating Binding:
As a result of the initial experiment’s inconclusive results, we decided to re-test the binding conditions after optimising the preparation of our gold nanoparticles to increase the yield and allow for 20 nm gold nanoparticles to be investigated since our preparations prior to the initial binding experiment were unserviceable due to extensive aggregation. The exact same set of samples were investigated and so were prepared following the same protocol. After all of the relevant cargo bay structures were annealed, they were then purified via PEG precipitation and the concentration of the DNA origami in each sample was determined using the nanodrop once again. From these calculations, each purified structure variant was then made into solutions containing a concentration of 3 nM. Exact concentrations and volumes of reagents used to construct the constant origami concentration across the samples can be found in the figure below.
The respective gold nanoparticles and Cy3 were added to the appropriate samples at maximum possible concentration. All samples were then incubated overnight at 40 degrees. The reaction mixtures involved in this incubation step include the following volumes of required reagents based on the designated target molecule as planned out:
As an improvement to the previous experiment which struggled to visualise the binding of target molecules, we added an extra step to be carried out after the overnight incubation with target molecules at 40 degrees. The extra step involved strands JS119 and MT42 being added to all solutions containing gold nanoparticles. The handles attached to the AuNPs consist of an anti-Mars sequence (designed for binding to the Mars handles attached to our cargo bay); JS119 contains Mars and anti-Neptune; MT42 contains Neptune-Cy5. Adding these to solution at [high] concentration and incubating for 2 hours at 40°C should result in Cy5 fluorophores attaching to any available handles on nanoparticles. Therefore, the detection of Cy5 fluorescence in barrel bands will indicate the presence of captured gold. Solutions were prepared at 1 uM and 1 uL was added to 13 uL solutions, giving ~80x concentration.
The annealed samples were split into two 13 uL aliquots, with the Cy5 fluorophore being added to one set. Two gels were prepared, at 1.5%, 11 mM MgCl2; one contained SybrSafe stain, and one did not. The Cy5 samples were run in the non-SybrSafe gel and both gels had nearly the same loading order in terms of the structure variants. The loading order is outlined below:
Gel Results and Discussion:
This gel was imaged using the GelDoc System under the Cy3 filter which will show the presence of Cy3 labelled DNA through fluorescence but is also capable of visualising unlabelled DNA due to the Sybr Safe stain although the effects of this on subsequent analyses of binding should be minimal since the concentration of DNA origami in each sample was controlled.
Lane 1 and 2 contain the negative controls, cargo bay structures that contain plain handles that will not target any molecules, including Cy3 and so as expected the origami bands are fairly faint. The next 3 lanes (3-6) contain the Cy3 functionalised handles for the tightly bound tether in all three different configurations (closed, loose, and locked open respectively). These lanes all contain comparatively higher levels of fluorescence in comparison to the negative controls indicating capture of Cy3 molecules in each of the configurations. The brightest fluorescence was detected in the functionalised closed barrel likely attributed to the additional physical factors trapping the cargo inside or potentially the passive capturing allowed through the open ends of the closed configuration. This could be both useful for maintaining the cargo inside but also present as an issue in future applications necessitating highly specific binding of nanoplastics for their removal from the bloodstream.
Whilst we were unable to confirm the binding of AuNPs into the origami structures with the gel results, we were able to demonstrate the improved experimental protocol for enhanced visualisation of AuNP capturing. This is because there are large, bright fluorescent bands at the bottom of the gel only in lanes where the AuNPs (that were functionalised with Cy5 fluorophores in the new protocol) were added. Thus, this new protocol can be employed in any subsequent experiments investigating the binding of AuNPs since we now know that we will be able to visualise the results.

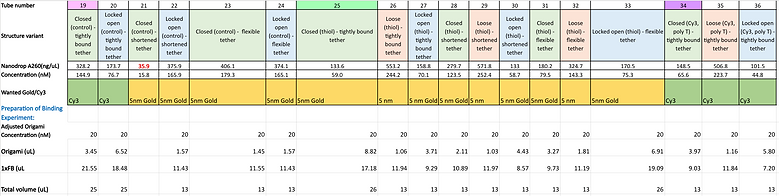
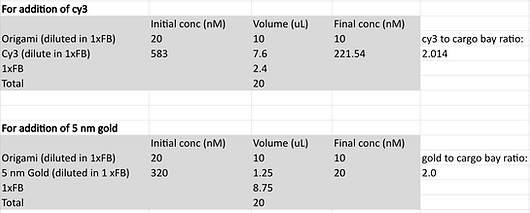
Figure 11: Cy5 fluorophore functionalised AuNP.
Created with BioRender.com
Note: Lanes 8, 10 and 12 were left empty in the gels. For the non-SybrSafe gel no blank space was left for the contents that was meant to fill lane 8.

Figure 12: 1.5% agarose gel, 11 mM MgCl2 run at 60 V for ~3 hours and contains SybrSafe stain.
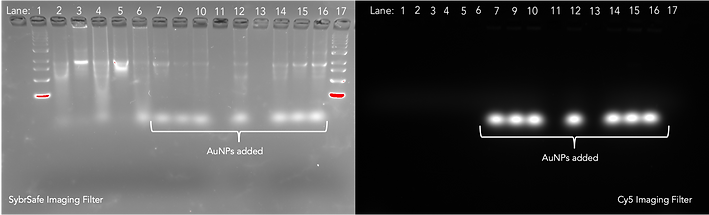
Figure 13: 1.5% agarose gel, 11 mM MgCl2 run at 60 V for ~3 hours and does not contain SybrSafe stain. This set of samples contained the additional incubation step with JS119 (Mars and anti-Neptune strands) and MT42 (Neptune-Cy5 which for addition of Cy5 fluorophore).
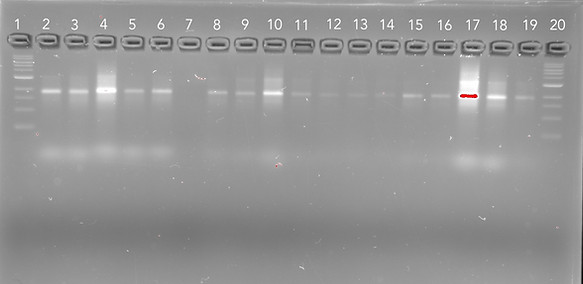
Figure 10: 1.5% agarose gel, 11 mM MgCl2 run at 60 V for ~3 hours and contains SybrSafe stain. Imaged on GelDoc system using SybrSafe filter.
Functionality of the Hinges
Background:
A major criteria for our barrel is the functionality of the hinges allowing for the opening and closing of the cargo bay to ideally open the structure to bind the target particles and subsequently close to trap them inside. This should ultimately lead to their removal from the surrounding environment which is our number one goal. We designed our cargo bay in conjunction with specifically crafted invader strands to allow for strand displacement reactions that will allow these functions to take place.
For our preliminary experiment investigating the switchability of our DNA origami structures, we decided to start with testing only the ability of the barrel to go from its sealed shut state to a locked open configuration. We planned to do this by utilising 20 nm AuNPs under the assumption that they will only bind to the cargo bay in the open state and not the closed state since in the latter configuration, the cargo bay has a flushed seal and the ends have an inner diameter of only 18 nm. Thus, we utilised a range of both positive and negative controls to provide substantial evidence that our design possesses the intended switchability.
Controls:
-
First negative controls (3 structure variants): cargo bay consisting of thiol handles in a closed configuration for all three tether lengths without the addition of invader strands
-
Expected result: should not capture 20 nm AuNPs
-
-
Second negative controls (3 structure variants): cargo bay consisting of plain handles in a locked open configuration for all three tether lengths without the addition of invader hands
-
Expected result: should not capture 20 nm AuNPs
-
-
Positive controls (3 structure variants): cargo bay consisting of thiol handles in a locked open configuration for all three tether lengths
-
Expected result: should capture 20 nm AuNPs
-
The experiment relies on strand displacement reactions where we expect the initially closed cargo bay to form the locked open configuration after incubation with the appropriate invader strands. Then we will confirm the change in state by sequentially incubating all samples (both experimental and controls) with 20 nm AuNPs where we should see binding for the cargo bays that have hopefully switched configuration.
Preparation of samples:
All relevant samples were prepared according to the following reaction mixture details which were then annealed according to our standard DNA origami cargo bay synthesis protocol. We then carried out PEG precipitation in order to purify our samples such that we only have our DNA cargo bay structures and have removed the excess DNA staples. The concentration of the DNA origami structure was then determined using the nanodrop by measuring the absorbance at 260 nm. Using these results, produce solutions containing 3 nM of DNA origami for each structure variant with 10 mM of MgCl2 using FB to make up the solutions to 25 uL. Add invading strands, labelled S* (to displace the sealing strands holding the cargo bay closed) and LL (to lock the cargo bay’s open configuration) to the three experimental samples at 50x concentration. For the nine controls, add Milli-Q water at the same volume of the invading strands. Incubate the samples for 24 hours at 40 degrees.
After this initial incubation step, add 2 uL 20 nm AuNP to all samples, centrifuge the samples to mix the solutions and incubate again for 24 hours at 40 degrees. Once completed, split each of the samples into two aliquots. Add 2 uL of Neptune (Mars/anti-Neptune and Neptune/Cy5) and continue incubating all samples at 40 degrees for 2 hours.
The samples were then split between two 1.5% agarose gels with the samples not containing any Cy5 to be run on one gel with the addition of SybrSafe stain and the other half to be run without SybrSafe. The gels were run at 60 V for ~3 hours. The loading order for both gels are as follows:
Gel Results and Discussion:
As discovered in the previous experiment, the fluorescently labelled AuNP has allowed for enhanced gold visualisation through the indirectly attached Cy5 fluorophore fluorescing under the Cy5 imaging filter used in the GelDoc system. In all three experimental samples, there are distinct bands demonstrating the capture of 20 nm AuNPs as expected if the switching of states was successful. This expected result is also confirmed by the distinct, dark bands present in the positive controls loaded into lanes 11 and 12 although the last positive control situated in lane 13 surprisingly did not capture gold yet the corresponding experimental sample did. This result is further supported by the negative controls loaded into lanes 2-4 which contain the closed cargo bays bearing thiol handles. The absence of distinct bands for this set of controls and undeniable presence of bands in the experimental samples demonstrates that the initially closed structures of lanes 5-7 must have opened in response to the strand displacement reaction occurring via the addition of invader strands.
It is also interesting that some variants of the second set of negative controls (lanes 9 and 10) that includes the locked open cargo bays possessing plain handles are seen to also capture the 20 nm AuNPs. This indicates the potential for the locked open configuration to capture molecules in a non-specific manner due to its shape which could be a potential issue in our proposed application necessitating the selective targeting of nanoplastics to remove them from the bloodstream. Although the discrepancies in the consistency of this result having two locked open variants (lanes 8 and 13 did not capture the AuNPs) makes it difficult to draw entirely conclusive results.
Overall, we are confident to say that this experiment demonstrates the ability of our design to switch from a closed configuration to an open one via the addition of our specifically designed invader strands.
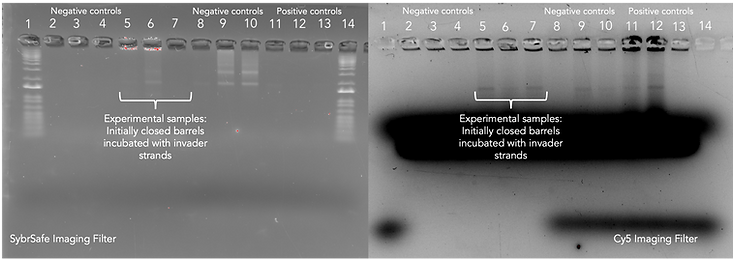
Figure 14: 1.5% agarose gel, 11 mM MgCl2 run at 60 V for ~3 hours and does not contain SybrSafe stain. This set of samples contained the additional incubation step with JS119 (Mars and anti-Neptune strands) and MT42 (Neptune-Cy5 which for addition of Cy5 fluorophore).
Cargobay Version 2
Background:
Our journey to create CargoBay Version 2 was fueled by insights gained from our initial gel electrophoresis experiments and TEM analysis of the original design, CargoBay Version 1. These investigations highlighted a significant issue—an excess of unused staple DNA strands in the folding process.
In response to this design oversight, we've introduced several critical enhancements in CargoBay Version 2. One of the most notable changes is the expansion of the barrel's length, featuring 15 repeating groups of three DNA helices sections, a threefold increase from the original five. This reimagined design now effectively utilises over 96% of the available DNA scaffold, addressing the inefficiencies observed in Version 1.
Furthermore, CargoBay Version 2 offers an increased number of locations for aptamers or handles. We anticipate that this augmentation will bolster Version 2's ability to capture target molecules from solution, surpassing the capabilities of its predecessor.
With these improvements, we are not only rectifying the issues encountered in our initial design but also pushing the boundaries of our research, as we strive to unlock new possibilities in the field of molecular engineering and nanoscale applications. CargoBay Version 2 represents our commitment to continuous innovation and our relentless pursuit of excellence in our endeavours.
Preparation of samples:
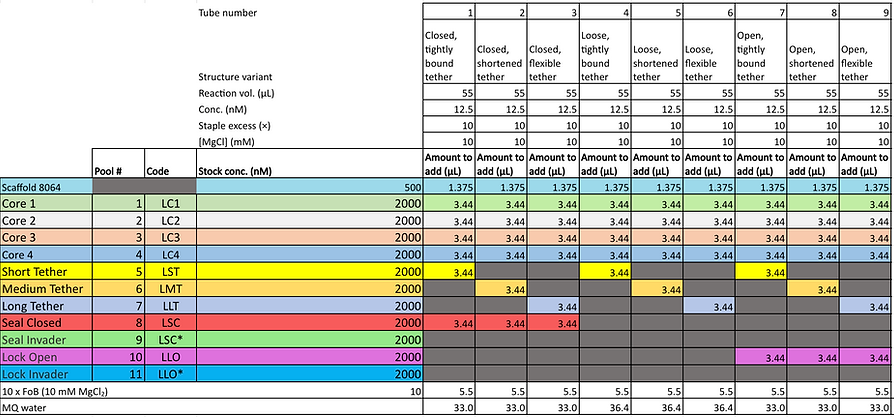
Figure 15: Pooling staples for CargoBay Version 2.
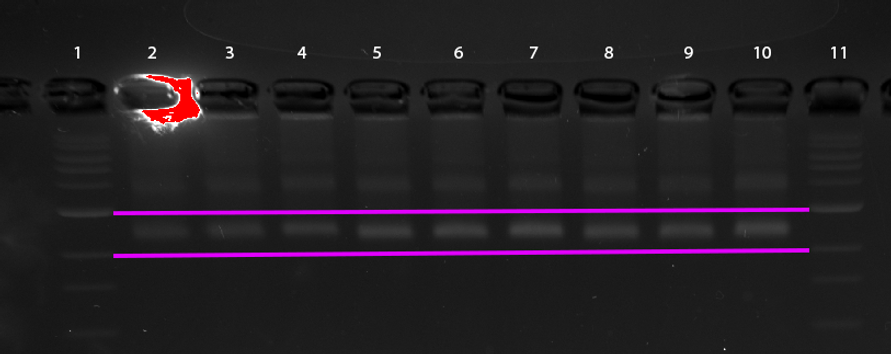
Figure 16: Gel electrophoresis of CargoBay Version 2 stained with SybrSafe. Lanes 2, 3, and 4 (closed configuration) exhibit consistent band thickness and sharpness, while Lanes 5, 6, 7 (loose configuration) and Lanes 8, 9, 10 (migrated further) appear more blurred, consistent with an open conformation. DNA ladder in Lanes 1 and 11 for reference. Some dimerisation is evident in all samples Gel ran at 1.5% agarose concentration. Horizontal magenta lines between DNA ladder sections provided for ease of analysis.
Figure 16 presents an exciting result, the visible differences between the different conformations indicates successful formation of the desired structure. The fact that we are able to observe differences between the bands itself is a marked improvement on Version 1, indicating the reduction of excess tether resulted in expected results.
These are promising preliminary results, however, before the deadline of the BIOMOD competition we will unfortunately be unable to produce TEM images of this most recent design.
Gold Nanoparticles
Background
In our ongoing research, we are exploring the potential of our CargoBay nanostructure to selectively capture specific particles from a solution. To carry out these experiments, we have chosen to employ gold nanoparticles (AuNPs). Gold nanoparticles are tiny clusters of gold atoms often coated with ligands. Several factors influenced our choice of AuNPs for this study:
1. Availability: Gold nanoparticles are readily accessible in our laboratory.
2. Optical Characteristics: These nanoparticles interact with visible light, giving them distinct colors based on their size, which simplifies identification.
3. Tailorability: Gold nanoparticles can be engineered to specific sizes, making them versatile for our research purposes.
Our CargoBay barrel boasts an inner diameter of approximately 18 nanometers (nm). According to our hypothesis, we predict that the smaller 5 nm AuNPs will pass through the CargoBay's aperture when it's closed, while the larger 20 nm AuNPs will not.
The ligands coating these nanoparticles play a crucial role in preventing aggregation. Aggregation occurs when gold nanoparticles physically interact in a solution, causing them to grow in size and reducing their solubility.
Gold Nanoparticle Preparation
When we obtain AuNPs from our supplier, they are typically coated with a ligand called citrate. However, citrate ligands are not suitable for our research objectives because our CargoBay requires nanoparticles with specific ligands for binding. To achieve this, we employ a multi-step process:
Citrate Removal: Initially, we remove the citrate ligands from the gold nanoparticles. This is accomplished by introducing a salt solution containing sodium chloride. The addition of sodium chloride reduces the energy of citrate dissolution, enabling the next step.
Phosphene Introduction: After the removal of citrate, we introduce phosphine ligands. This replacement is facilitated by the presence of sodium chloride, creating an intermediate stage in our preparation process.
Phosphilination of Gold Nanoparticles Protocol:
Phosphene used is: 4,4′-(Phenylphosphinidene)bis(benzenesulfonic acid) dipotassium salt hydrate
Day 1:
-
Take 50 ml of colloidal gold solution (citrate-capped).
-
Add 10 mg of phosphine (solid), cover this with aluminium foil, and stir slowly for 24 hours
Day 2:
-
Slowly add sufficient NaCl so that the colour changes from red to bluish (about 1-2g is sufficient) (Day 2).
-
Centrifuge at 1000 g for 30-35 minutes in a bench-top centrifuge in 50 mL tubes.
-
Gently take out the supernatant (slightly yellowish) with a 35 ml pipet, discard. For the last drops, use a 1 ml pipet to withdraw. Don't disturb the pellet at the bottom of the tube.
-
Add 1 ml of 0.5 mM phosphine to re-suspend the particles. The colour of the particles changes from black-purple to dark red.
-
Add sufficient methanol (colour changes to black again) and centrifuge at 1000 g for 30 minutes.
-
Discard the supernatant and re-suspend particles in 1 ml of 0.5 mM phosphine. Transfer the solution to a 1.5 mL tube.
-
This is the phosphilinated gold solution; cover it with aluminium foil and keep it at 4 degrees Celsius for storage.
-
Measure zeta size by using 1 uL of 1 uM in 1 ml TE
-
Sonicate for 5 minutes.
Thiolated DNA Strand Introduction: Following the replacement of citrate with phosphene, we then introduce thiolated DNA strands. These DNA strands are carefully designed to be complementary to the specialized "handle" strands on our DNA nanostructure.
Thiolation of Gold Nanoparticles Protocol
Day 1a: Conjugate oligo and AuNP
-
Add DNA first, then NaCl, adding an excess (100X) DNA compared to gold to the gold solution.
-
To a final concentration of 0.2 uM gold nanoparticle, 20 uM Thiol DNA, 100 mM NaCl, 1xTE buffer, and a final volume of 100 uL add:
-
Gold nanoparticles
-
TE Buffer
-
Thiolated DNA
-
NaCl
-
MilliQ water
-
Day 1b: Purify the gold NPs:
-
Prepare the filters with an equilibrium step to match the previous buffer the gold NPs are submerged in.
-
Use 500uL 1 x TE buffer (to match the already used buffer) to fill the column and centrifuge at 14,000g for 5 minutes at 4°C.
-
Discard the supernatant containing TE buffer and ions originally in the column.
-
Add 100 uL of gold nanoparticle solution.
-
Fill the column with 400 uL 1 x TE buffer.
-
Spin at 14000 g for 5 minutes at 4°C.
-
Discard 400 uL of supernatant.
-
Repeat steps 4-6 five times to ensure good purification.
-
Invert the column to release gold into the Eppendorf tube.
-
Centrifuge at 1000 g for 5 minutes at 4°C.
-
Nanodrop, blanking with 1x TE buffer to determine the yield of nanoparticles.
Day 2: Passivate AuNP-oligo complex with PEG thiol
-
Add PEG to yield a 3000 concentration ratio for PEG:AuNP.
-
Top up the salt to make a 100 mM final concentration.
Conclusion
This multi-step process ensures that the gold nanoparticles have ligands compatible with our CargoBay nanostructure, enabling specific binding interactions. Additionally, we have conducted experiments with different types of ligands to address aggregation issues encountered with the 20 nm gold particles and enhance the stability and solubility of our nanoparticles.
Optimisation of Gold Ligands
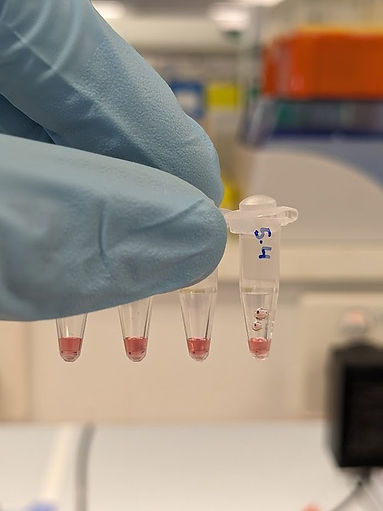
Figure 20: 5 nm gold nanoparticles with varying ligand preparation protocols. From left to right: 1. Incubated with normal SM015 thiol strand, 2. Incubated with 1:1 ratio of SM015 and ML0050, 3. thiol poly-T, Incubated with half volume of SM015 for one day and ML0050 added the next day, 4. A control, with no DNA. All 5 nm gold nanoparticles are homogenous in colour indicating no precipitation in any of the protocols.
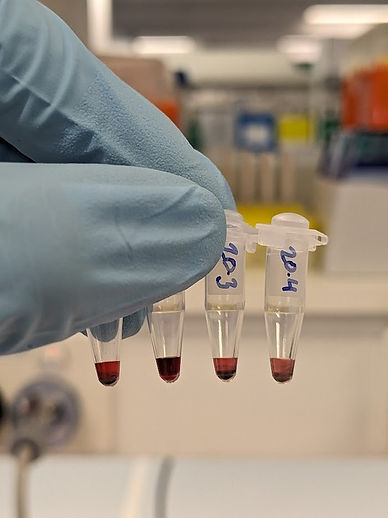
Figure 21: 20 nm gold nanoparticles with varying ligand preparation protocols. From left to right: 1. Incubated with normal SM015 thiol strand, 2. Incubated with 1:1 ratio of SM015 and ML0050, 3. thiol poly-T, Incubated with half volume of SM015 for one day and ML0050 added the next day, 4. A control, with no DNA. Tubes 1, 3 and 4 show inhomogeneous colour indicating aggregation and precipitation of gold. Tube 2 shows a homogeneous colour, indicating the polyT ligands are working as expected to reduce aggregation in this protocol.
In our pursuit of using gold nanoparticles as a target substrate, our initial experiments revealed areas in need of protocol refinement, particularly in working with 20 nm gold nanoparticles, where aggregation tends to be problematic
To address these challenges, we have embarked on experiments aimed at optimising gold ligands to mitigate the aggregation of 20 nm gold nanoparticles. These experiments involve three distinct methods:
-
Incubation with Normal SM015 Thiol Strand:
In this method, on the first day, we combine 5 μL of gold nanoparticles (AuNPs) with 3 μL of the SM15 thiol strand, along with precise amounts of H2O, TE to 1x, and NaC to 10 mM. Subsequently, we undergo a process of filter purification on the second day, followed by a gel run on the fourth day to assess the results.
-
Incubation with a 1:1 Ratio of SM015 Thiol and ML0050 Thiol Poly-T:
In this method, on the first day, we mix 5 μL of AuNPs with 1.5 μL of SM15 and 1.5 μL of ML50 (a thiol poly-T strand), alongside specific quantities of H2O, TE to 1x, and NaCl to 10mM. On the second day, we introduce an additional 1.5 μL of ML50, followed by a process of filter purification on the third day. Finally, we conduct a gel run on the fourth day to assess the outcomes.
-
Incubation with Half the Volume of SM015 Thiol for One Day and ML0050 Thiol Poly-T Added the Next Day:
In this method, we commence by combining 5 μL of AuNPs with 1.5 μL of SM15, along with appropriate amounts of H2O, TE to 1x, and NaCl to 10mM. On the second day, 8 μL of ML50 is added to the mixture. The third day involves filter purification, and on the fourth day, a gel run is performed for analysis.
Furthermore, to facilitate comparative analysis, we have included a control group with no DNA. In Methods 2 and 3, the introduction of poly-T strands aims to create a dense brush on the surface of the AuNPs, with the intention of reducing surface-surface interactions between the nanoparticles.
Results:
As evident in figure 20, there is a lack of aggregation in any of the 5 nm samples, attrutable to the inherent stability of this size of nanoparticle. However in figure 21 there is aggregation in all but tube 3. This points towards the modifications made with the polyT ligands as being successful in preventing aggregation.
General Protocols
Background:
Gel electrophoresis is a technique used to separate DNA, RNA or proteins based on size and design. Agarose-gel electrophoresis serves as an effective method for high-resolution separation of DNA origami structures. DNA exhibits a uniform mass/charge ratio, bearing an overall negative charge derived from its phosphate backbone. This charge allows it to migrate through the gel in response to an applied electric field, migrating towards the positively charged anode based on its size. The rate of of migration of a DNA molecule through a gel is mainly determined by the size of the DNA molecule, DNA conformation, agarose concentration and the voltage applied.
The concentration of the gel determines the characteristics of the molecular sieve which is directly attributed to the gaps between interconnected agarose chains. In general, higher concentrations result in smaller pore sizes, which, in turn, increase the resistance encountered by molecules as they travel through the gel.
Gel casting:
-
For one gel box, dissolve an appropriately calculated mass of agarose (based on the % agarose gel desired) in 150 mL 0.5 TBE buffer in a large beaker.
-
Heat the solution in the microwave for 30s, gently swirl the beaker to mix the solution. Repeat this until the solution becomes clear and small bubbles are present.
-
Have a bucket of cool water ready.
-
Gently swirl the heated solution in the water to cool it to ~60 °C. Be careful not to overcool to prevent the formation of the gel inside the beaker itself.
-
Add 1.65 mL 1M MgCl2 (from 1L stock).
-
Add 3 uL SyBr safe stain. Mix the solution.
-
Pour the gel solution into the agarose gel kit with the gel tray sealed at the sides. Use the tip of a pipette to remove air bubbles if necessary.
-
Insert an appropriately selected comb depending on the number of lanes and thickness of wells desired.
-
Let the gel set for ~40 mins.
Sample loading and running the gel:
-
Organise a layout the loading order of samples to be run in the gel. Always load a molecular standards ladder at either end of the gel to allow for evaluation of how the gel ran and for the quantification of the size of DNA fragments of interest.
-
Add running buffer (0.5x TBE, 11 mM MgCl2) ensuring the buffer covers the gel.
-
Remove the comb from the gel.
-
Load each sample being careful not to poke through the bottom of the gel.
-
Run the gel at a constant voltage for a couple of hours (specifics dependent on each experiment)
-
Remove the gel from the gel kit and image using the GelDoc system.